Video Walk-Through
Step-by-Step Instructions

This exercise is one of the most interesting and most important exercises of all of FOCUS - it's also one of my favorites. It is called the Path to Victory.
Problems it Solves
1. Reality CheckThe first reason this exercise is so important is that it will help you determine if your Victory will be realistically achievable given both the customer segment and the channel you chose.
If it's not, you'll want to know sooner than later - now is sooner. If it is, then this exercise will help you...Is this a feasible path to get you where you want to go?
2. Map Out All of Your Experiments
This exercise will help you develop a road map out all of your experiments between where you are now and your product-market fit. The FOCUS Framework will support you through implementing each of these experiments.
In this exercise you will be working with a spreadsheet, instead of a worksheet, to help you with the calculations. Every number in this spreadsheet will have to be validated: every number will represent an experiment that you will run to bring you further down your path.
3. Define Success Metrics
Finally, for each of your experiments going forward, you're going to define a success metric - a number that determines whether or not you've validated one of your business model hypotheses.
Typically these metrics are difficult to derive but it's not always clear what success looks like. Is a 2% conversion rate success or should it be 5%? What is a successful Customer Acquisition Cost for you? What should your Viral Coefficient be in order to reach escape velocity? How do you know where to set your Customer Lifetime Value success criteria?
Fortunately, this exercise will start to answer all of these questions, and more, by helping you define each of your success metrics.
What is a Path to Victory?
- Connecting the Dots
This is going to be difficult because there are a lot of unknowns. You may find this exercise uncomfortable because it involves making some assumptions about the future and possibly facing some not-awesome facts; however, at the end of the day asking yourself these questions will sanity-check your path to Victory.
- A Path Paved with Assumptions
By naming and embracing each of the assumptions in your Path to Victory spreadsheet, you will know exactly what to test at every step along the path. As new data comes in, you will be able to use these tools to be flexible enough to respond to the real-time data from your real-life customers.
- Modify as Appropriate
Make any changes to the spreadsheet that make sense for you.
Pack Your Bags
Before we start down the Path to Victory, here are two concepts you need to bring with you:Prerequisite #1 - Pick 3
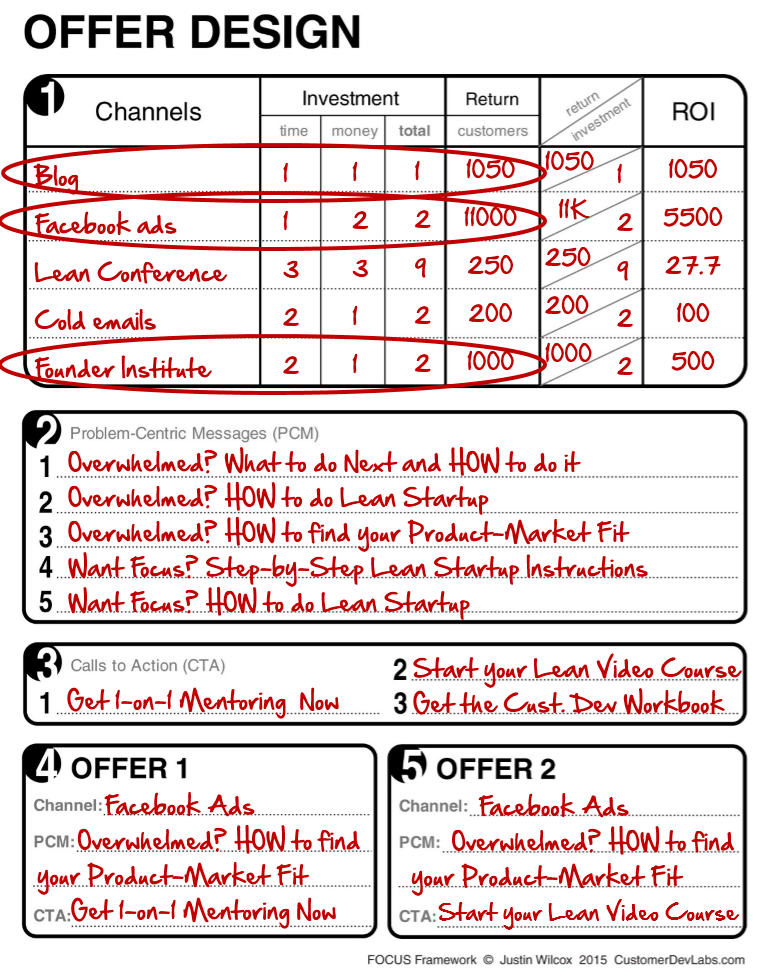
 You will start with the results of the previous exercise. On the Offer Design worksheet, circle the three channels that had the biggest potential return on investment. You will leverage those as part of this exercise.
You will only choose 3 channels because winning in any more than 3 will be difficult. The more channels you choose, the thinner your resources will be spread. It is most likely you will "win" in one or two of these channels.
Prerequisite #2 - Size Matters

Before we start in on this exercise, I want to remind you about the Adoption Lifecycle Curve from Who are your Early Adopters.
Based on this curve, your Victory lies with capturing your Early Majority. However, in order to capture your Early Majority, you first have to win over your Early Adopters.
In this exercise you will start measuring the size of your Early Majority and Early Adopter subsegments.
During this exercise I will be referring to the Early Majority+ (the combination of your Early Adopters and Early Majority). This number is the total number of people who know they have a problem.
Pave Your Path
Open up your Path to Victory spreadsheet. When you open this spreadsheet, you will notice that all of the "calculated fields" will be locked. This is just to protect you so that you do not accidentally overwrite a calculated field.
 If you would like to make changes to the spreadsheet, you will need to unlock it by going to UNPROTECT WORKSHEET and typing in the password FOCUS.
Step 1

 Your first step is to write in your Victory goal. For me, that is $1 million in the bank.
Next, you will calculate your Annual Victory Revenue.
Your Annual Victory Revenue is how much you will have to make each year in order to achieve your Victory in a desired amount of time. How you calculate this is up to you. However, I have included a worksheet you can use to find this number.
No matter how you are measuring your Victory - even if it's not with money - you will need to represent this number with a monetary value.
Here's an example.How much revenue will you need to make sure that you get your Victory?
- For me, my Victory is $1 million in the bank: $1,000,000
- I wrote in what's in the bank currently: $250,000
- I calculated the difference: $750,000
- Next, I chose the amount of time I would like to give myself to achieve this Victory: 6 years
- I know that success does not come right away, so I want to give myself some buffer time to get the ball rolling: 2 years
- Now I can see how many years in a row I'll have to achieve my Annual Victory Revenue: 4 years
- A simple division tells me what I will have to make each year: $750,000 / 4 = $187,500
- Add on taxes and expenses: $343,000
This is my Annual Victory Revenue.
Use the blue section of the spreadsheet to calculate and turn your Victory Declaration into an Annual Victory Revenue.
Step 2
 The next step is to calculate your Product Revenue.
In this step you will come up with two numbers. These are hypotheses now, and will be tested in experiments as you move forward to make sure they are accurate.
First, write in the hypothesized price of your product.
Second, write in the number of Lifetime Purchases from an average customer.
For example, if you have a product with a monthly fee, you would write in the number of months you'd expect the average customer to stay with you. If you have a product that is a one-time purchase, the Lifetime Purchases would be 1.
Step 3
 In this step you will determine your Offer and Currency Conversion Rates. Complete each row as described below.
Early Adopter Segment: First, write in your Early Adopter Segment at the top of the first column.
 Channel: Next, pick one of the 3 channels with the highest ROI from the previous exercise. Write this in under your Early Adopter Segment next to Channel.
Annual Reach: Now, pull in the "Reach" numbers from your Offer Design worksheet. This is how many customers you could reach within 2 weeks (or at a one-time event).
Extrapolate that number to a full year. If you dedicated yourself to distributing an offer to these channels, how many customers could you reach within a year?
Note: in some cases you may be able to just multiply by 26 (to get 52 weeks), but in some cases it may be a different algorithm. In my case, since my blog has a regular pattern of visitors and new subscribers, I can do a simple multiplication calculation.
If my channel was a conference, which say happens twice/year, I'd multiply the 2-week rate by 2 and then probably subtract some percentage of people who would be at both conferences.
Calculate an approximate Annual Reach for your channels.
Offer Conversion Rate (OCR): This number represents the number of people who have seen your offer and engaged with it. This may mean:
- Clicking your ad
- Responding to an email
- Otherwise shown curiosity in a positive way
For B2C, the following are some guidelines for calculating your predicted OCR at this point in time:
- If you are very optimistic, and believe this offer is going to crazy-resonate with folks, write in 10%.
- If you are realistic, write in 5%.
- If you are pessimistic, and believe that your offer may not resonate, or just wish to be conservative, write in 2%.
- If you are very optimistic, a strong conversion would be 50%. You are most likely to get this level of conversation rate from a very targeted, personalized offer (i.e. cold email), using strategies discussed in the Finding Your Early Adopters Exercise: How to Ask for Interviews.
- If you are realistic, write in 25%.
- If you are pessimistic, and believe that your offer may not resonate, or just wish to be conservative, write in 10%.
Currency Conversion Rate: Of the people who have expressed interest in your Offer, how many people will give you the actual currency you will need to achieve our Victory?Note: Your offer conversation rate is not purchases. It is how many people positively engage with your offer.
In most cases, it is likely to be cash. However, if you are measuring "impact" your currency would be the number of people actively engaging with your product.
Regardless, your currency conversion rate is your ultimate conversion rate: these are the folks who will lead you to Victory.
A typical number for this will be in the range of 1-10%.
If you are pessimistic, you may put 1%.
If you believe you will achieve an average conversion rate, your numbers will be between 2-3%.
If you are optimistic, your number may be as high as 5%.
In my case, I will estimate 3%.
Now, you can see the spreadsheet has automatically calculated your Annual Early Adopter Rate for this channel. In my case, I'm estimating 95 Early Adopters per year.
Of course, this is an assumption, built upon several other assumptions, so I have little faith that 95 is the correct number. Still, it gives you a starting point to base your experiments on. You'll revise these numbers as you continue with your experiments, collecting more data.
Repeat
 Repeat this process twice more, changing either the channel or the customer segment for each. Once you do, you'll see the estimated total annual Early Adopters calculated.
Please note: I do not recommend doing this process with more than 3 channel/customer combinations. The reason is that you have limited resources. If you are trying to serve too many customers, or execute in too many channels, you will serve no one well. Always remember flying cars...
Step 4
In this step you will estimate the size of your Early Majority.Below you will find a familiar curve:
 This is the Diffusion of Innovations Curve, which looks very much like the Early Adoption Curve you have seen in previous chapters. This curve has 5 categories instead of our familiar four. The extra category is called the Innovators.
I don't talk much about Innovators because I consider you and others trying to build a solution to the problem the Innovators. Your customers are not the Innovators, but rather they show up as the group of people in search of a solution - Early Adopters, and so on.
In the curve I am presenting to you now, you can see there are percentages attached to each category. This is to represent how large they are, or how much of your customer base is likely to be represented by each section.
This curve is based on some research by Evert Rogers and the data comes from his work in the 1960s synthesizing research of some 500+ diffusion studies. You are going to leverage his research to build our own hypotheses and, then, experiments.
If you look relative sizes of the Early Adopter (13.5%) and the Early Majority (34%), you see that the Early Majority is roughly 2.5 times the size of the Early Adopter.
In other words, from this curve, you can say, "If I have Y Early Adopters, I will have about 2.5 x Y Early Majority." This is helpful because it's the Early Majority that will lead to your Victory - so it's the size of the Early Majority that you want to estimate!
Now take a look at Step 4 in the spreadsheet.
 In this section you'll actually calculate your Early Majority Revenue in an Optimistic way, a Pessimistic way, and an Average way.
Optimistic: In the 3rd row of the "Optimistic" column, you will see that the ratio of Early Majority to Early Adopters is just over 2.5.
With this number, you can calculate the estimated Annual Revenue based on the size of your combined Early Adopter and Early Majority.
The formula to calculate your annual Early Majority+ revenue is:
The "+1" ensures you are counting both your Early Majority, and your Early Adopters, towards your annual revenue.Annual Early Adopters * (EM to EA Ratio + 1) * Customer Lifetime Value
In the illustration case, our actual Annual Revenue comes to $149,688.
The spreadsheet will automatically populate your Victory Revenue and calculate the difference between it, and your Annual Early Majority+ revenue. If the difference is positive, you are good to go. If the difference is negative, you are coming up short.
Pessimistic: While we are hoping that the ratios represented in Roger's curve are accurate, I want to recognize that this research is over 50 years old and given that these numbers may not hold true for every innovation, it seems wise to take a look at what happens if we consider some different scenarios.
For example, what happens if the Early Majority percentage is half of what Rogers estimates it to be? Let's call this the Pessimistic scenario.
In this scenario, your estimated Early Majority+ revenue is cut by about 1/3 from the Optimistic scenario. That's a fair and conservative estimate in my mind.
Average: In order to achieve a more balanced estimate, you can average the Optimistic and Pessimistic views together to create what might be a more realistic picture.
The reason for calculating these three numbers is simply to hedge your bets. Personally, I like to be conservative when calculating these numbers to make a surer bet on my Path to Victory. You can choose what works best for you.
In the graph below, you can see a visual representation of your data. The orange bar represents where you need to be to achieve your Victory Revenue, and the blue bars represent the different scenarios for the three conditions we discussed.
 This graph will show you if you are on your path to Victory. For me, things are not looking so good. This means that things are going to have to change to make it worth my while to continue down this path, victoriously.
If you notice, by changing various numbers on the spreadsheet, you can change your path. Play around with it. It may be worth thinking about changing your price, your timeline, your channel, or your conversion rates.If you find you're on the wrong path, now is the time to course correct.
This is the thing that is driving you, and will continue to drive you, so that you don't lose your focus. Feel free to change any number but that one.What I don't recommend is changing your Victory.
Alternate Path
When your numbers aren't coming out in your favor, there are a few steps you can take within this spreadsheet itself. This exercise is meant to highlight the assumptions that most need your attention.- Will this price point get you to your Victory?
- Is it better for your path to offer a one-time or subscription service?
- Will you need to double your reach or conversion rates for one of your channels?
Thinking about my potential solution, I might be able to focus on increasing the Lifetime of a customer from 6 months to 9 months.
I can also change my price. $29 is a pretty low price point. Let's try $49.
Looking at my three Channels, I know that if I work at it I can substantially increase my annual reach if I really focus on my blog.
I may also be able to alter my conversion rate of either my Offer or Currency Conversion and see what happens if I focus on converting more customers at either the offer or currency stage.
Now things start to look differently.
 With a few changes within this exercise, I start to see that I can meet my goals in the Optimistic and Average scenarios. The most conservative, or Pessimistic, scenario, I'm still below my goal.
Overall, this may be enough for me to feel confident to move forward. If not, I can always go back to a previous exercise.
Be realistic. Don't move forward until you are confident that this is the right path.
Rude Awakening
Here is an example of how this spreadsheet could alert you to some critical red flags on your path. Imagine my Victory was not dollars in the bank, but the size of my impact. I can still use this sheet to figure out my Path to Victory.
I have put here a Victory of "1 million founders mentored". To convert that into Annual Victory Revenue, I factor in my associated costs. How many mentors will I need? What will I pay them? What are the acquisition costs? And so on.
The actual amount of income that I will need to make this happen is just shy of $12 million.
As I fill out the rest of the worksheet, it becomes clear: it's very unlikely I'll be able to achieve Victory via this path:
 If you run into this scenario, the answer is very simple: you have to go back. You have to find a different opportunity that is going to make this Victory easier to obtain.
It doesn't mean you should change your Victory - you just need to find the right combination of customers and problems that will lead you to it.
Assumptions and Limitations
 Your business is not only an entrepreneurial endeavor, it's a research project. Every research investigation has its assumptions and limitations which help you remain realistic about the data you're collecting. Take these assumptions and use them to your advantage: validate every number on this spreadsheet so you know you are on sure footing for every step on your Path to Victory.
Here are the assumptions to take into consideration so that you can use this tool most effectively for your business:
- Until proven otherwise, everything in this spreadsheet is a guess. Your job is to go out and validate every one of these numbers to make sure that you are not guessing, and that this is a representation of reality.
- The Customer Lifetime Value is realized in the first year. Make sure you take into account longer term contracts, such as in B2B contracts that may be over 5-10 years. When you are calculating your Victory, don't make the mistake of rolling the value of 10 years into 1.
- There is no accounting for Late Majority or Laggards in this model. If it's me, I'm not counting Victory as when I achieve my very last customer. I want Victory sooner than that. My growth will continue over time, but I'm more concerned about those first customers and the Early Majority that follows. Anything else is a bonus.
- This spreadsheet assumes that the Early Adopter and Early Majority segments are fixed numbers and will not increase or shrink over time.
- This exercise does not account for Channel Saturation. If my customers in any given channel might dry up over time, I may have to modify the spreadsheet to account for that, adjusting my annual reach. This might happen in a situation where everyone who may be interested in my solution has heard about it. Think: Snuggie. Think: Facebook.
- This exercise assumes you are only operating with three Channels. As I stated above, if you need more than three channels, you are likely spreading your resources too thin. However, every business is different so this is an assumption that I am making about you.
- This exercise assumes the same price for each customer or channel. It's possible you may be charging different prices for different customers or channels. I encourage you to change this spreadsheet to meet your needs.
- Finally, the Diffusion of Innovation Curve ratio is from the 1960s. It is an assumption that this data holds true in this day and age, and that it will hold true for your business.
Recap
Your goal was to draw a line between where you are now and where you want to be.Reality Check: This spreadsheet is designed to show you if your path is feasible, and if not, why not. Hopefully, you've been able to identify the aspects that can change to increase your chances that you're on the right path.
Know What to Validate: You intuitively know your path is paved with assumptions. However, this exercise has highlighted exactly what those assumptions are, so that you can validate them. Each experiment you run going forward will be designed to validate the numbers you've estimated here.
Success Metrics: You've also just identified the numbers you have to meet in order to make your calculations work. If you are not able to meet these, you will know right away that something needs to change.
Finally, it's important to know that you can modify this spreadsheet as appropriate: either by changing different aspects of your offer, or by adding in additional information specific to your business.
What's Next
Once you're confident you can achieve your Annual Victory Revenue, it's time to start designing your experiments. The next chapter will lead you through the experiment design process, so you know how to accurately validate each of your assumptions.How can we help?
Have a question about Path to Victory? Or did you use/teach the exercise and discover something that may help others?
Our community thrives when you share your experiences.